
What Explains the Uneven Pace of Electric Vehicle Transitions Across the United States? A Comparative Study of California, Michigan, and Texas
By Kejia Yang, Hengrui Liu, and Kate Hua-Ke Chi
As the world enters its ninth month of the oil shock caused by the closure of the Strait of Hormuz, global electric vehicle (EV) demand has risen sharply. Taken together, factors like higher fuel prices, lower battery costs, more affordable EV models, and increasing EV exports from China have accelerated the global EV transition. However, the pace and scale of EV transition differs across countries. While EV market penetration has risen rapidly in Europe, Southeast Asia, and Latin America, the United States is an outlier. Battery EV market share fell back to 6% in the second quarter of 2026, down from 7% in the second quarter of 2025. The U.S. EV slowdown stems from the elimination of EV incentives, policy uncertainty, loosening fuel economy rules, high tariffs on auto parts and components, and limited access to affordable EVs from foreign producers.
Against the backdrop of the U.S. EV slowdown, a new journal article published in Global Sustainability and authored by Kejia Yang, Hengrui Liu, and Kate Hua-Ke Chi of the Climate Policy Lab examines the U.S. EV transition at the subnational level to shed light on the fundamental issues dragging the U.S. EV transition at the aggregate level.
The EV transition presents a major opportunity for the United States to cut greenhouse gas emissions, transform its legacy automotive industry, build an EV supply chain, and create new jobs, while also posing transitional challenges for incumbent automakers and their workers and meeting resistance from interest groups such as the oil and gas industry. The study focuses on three representative EV transition cases in the United States: California, Michigan, and Texas, and reveals that the pace of EV adoption depends on the interplay between reinforcing (positive) and balancing (negative) feedback loops, both of which shape and are shaped by local governance capacity and policy orientation within the EV ecosystem.
Socio-Technical Feedback and Transition Acceleration Paths
At the subnational level, why do places transition to EVs at different speeds? Drawing on literature on sustainability transitions and socio-technical feedback, we approach the shift to electric vehicles as a broader socioeconomic transformation, involving evolutions in manufacturing capacity, charging infrastructure, power systems, consumer behavior, and public policy.
To that end, our study employs the concept of feedback loops. Reinforcing loops are self-amplifying, so progress in one area generates further advancement. We identify five of these reinforcing loops currently affecting the EV transition:
Industrial transformation: investments and expanded manufacturing capacity facilitate economies of scale, and job creation further strengthens societal and political support.
Technological change: learning by doing improves performance and lowers costs.
Behavior change: the growing visibility of EVs normalizes them and drives adoption.
Infrastructure investment: more charging infrastructure builds consumer confidence, which attracts further investment and enables EV adoption.
Environmental legitimacy: air quality improvement from EV usage sustains support for policy.
There are also two balancing loops pulling in the opposite direction:
Legacy automotive lock-in reflects the sunk investments, supplier networks, and skills tied to internal combustion engines.
Oil industry resistance reflects the political influence of fossil fuel interests.
Additionally, two endogenous contextual moderators, governance capacity and policy orientation, structure how feedback dynamics emerge and interact in different settings.
Comparing EV Transitions in California, Michigan, and Texas
The study compares three U.S. states, California, Texas, and Michigan, which represent a regulatory leader, a market-oriented follower, and a structurally constrained laggard, respectively. It draws on policy documents, statistics, and 31 semi-structured interviews conducted in 2025 with officials, academics, utility experts, industry representatives, and non-profit analysts.
California leads by a wide margin. In 2023, EVs made up about 26% of annual vehicle sales, compared with roughly 6% in Texas and 4% in Michigan. California also had 322 EVs per 10,000 residents, against 75 in Texas and 50 in Michigan. We trace this to the success of air-quality regulations, beginning with the California Air Resources Board and then the Zero-Emission Vehicle mandate. Concern about smog built durable political coalitions and public buy-in, and agencies learned to coordinate manufacturing, charging, and workforce goals. All five reinforcing loops are strongly present.
Texas shows moderate progress driven largely by markets. Texans tend to drive longer distances, and with high gasoline prices and a wider menu of affordable EV models in the state, they are often a practical choice. The state has also attracted major manufacturing, including Tesla’s Gigafactory in Austin. Yet Texas has no clear policy direction on EVs. Its hydrocarbon economy produces strong oil industry resistance, and the state also imposes a $200 annual EV registration fee. However, it is worth noting that Texas produces more wind power than any other state in the U.S., and many energy companies are expanding into renewable alternatives. But the state still gets a lot of its electricity from natural gas, so fossil fuel producers paradoxically benefit from rising electricity demand due to EV adoptions, illustrating a more complex reality of EV transitions.
In comparison, Michigan lags, despite being home to the Big Three automakers. While Michigan has world-class engineering and research strength in the auto industry, this expertise has long focused on improving gasoline engines. The auto industry contributes about 27% of gross state product, and this concentration shapes policy. State officials describe designing policies to accommodate automakers rather than to lead the industry. Policy has also swung between administrations, so industrial strategies have been repeatedly reset before they could produce the jobs and supply chains needed to build lasting support. Fast-charging remains concentrated in southeast Michigan, and a 2025 road-funding agreement gave the state the highest EV registration fees in the nation, undermining the behavioral change loop.
Reinforcing and balancing dynamics of U.S. EV transitions
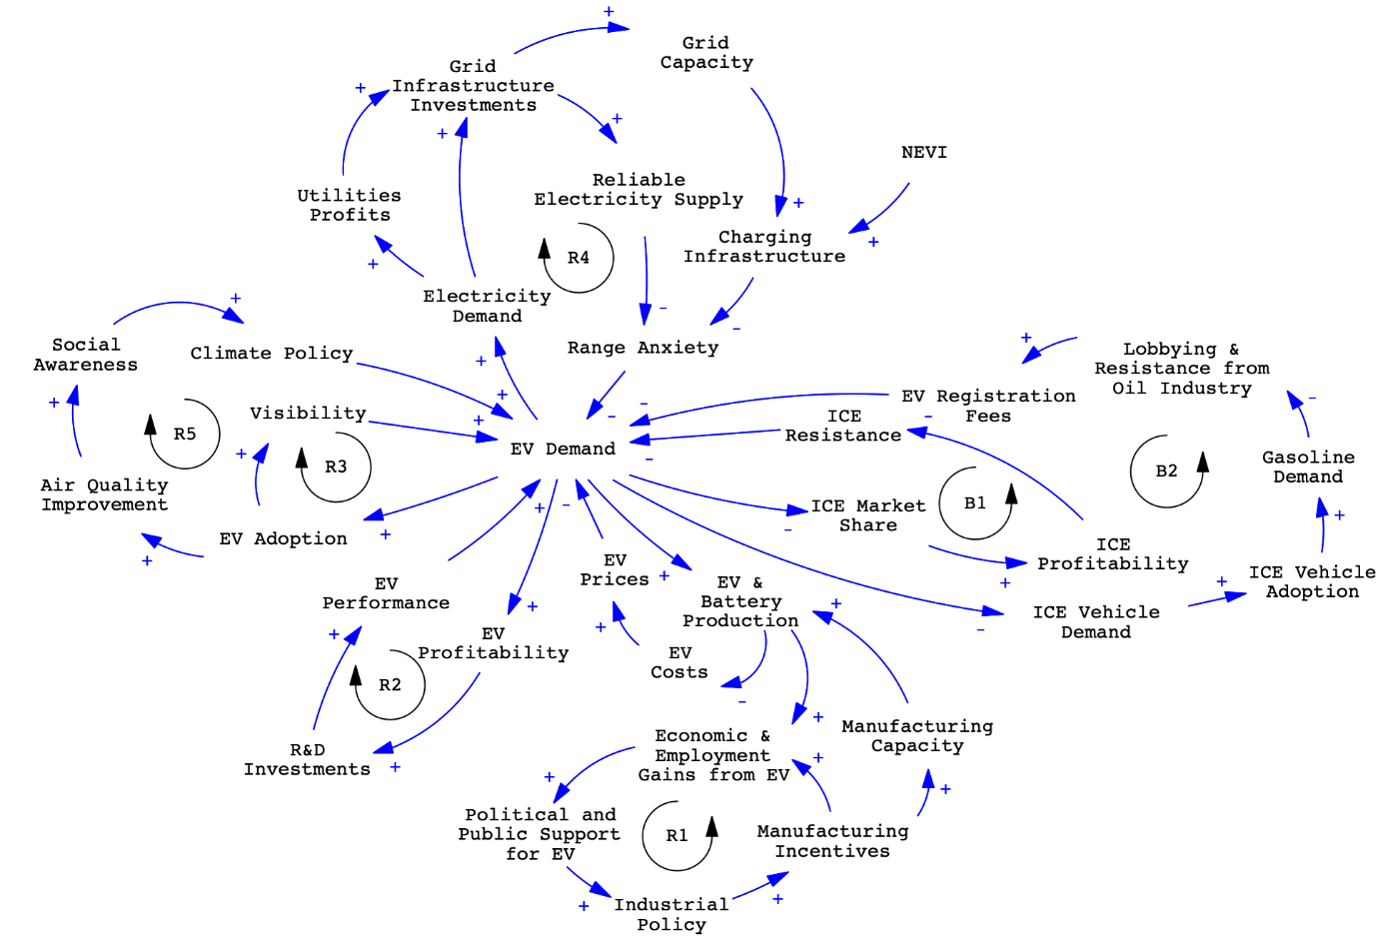
Legend: R1 Industrial transformation loop; R2 Technological change feedback loop; R3 Behavior change feedback loop; R4 Infrastructure investment feedback loop; R5 Environmental legitimacy feedback loop; B1 Incumbent protection balancing loop; B2 Oil industry resistance loop.
Effective Transition Policies Cannot be Designed in Isolation from Regional Contexts
The study shows that EV transition pathways diverge at the subnational level because socioeconomic conditions vary across regions. These differences stem from distinct industrial structures, institutional histories, and policy environments, which shape the composition and dynamics of regional feedback loops.
With federal EV policy being rolled back, maintaining the EV transition's momentum is even more important at the subnational level. To make the EV transition sustainable, effective policies should strengthen local reinforcing loops and resolve balancing loops, rather than focusing only on top-down policy overviews.
The framework can be applied to other regions and sectors to study technological transitions, identify the dynamics of their corresponding feedback loops, and provide a systemic analysis of transitional challenges. For policymakers, advocates, or industry leaders working on technological transitions, identifying the specific regional feedback dynamics, distinguishing between reinforcing and balancing loops, and implementing targeted supportive policies will be key to accelerating transitions from the regional to the national level.
Read the full article here.